분류에 사용한다. (Classification)
예시) 나이대별로 이메일을 클릭해서 열지 말지를 분류 해봅시다.

이메일 클릭을 할 사람과 안할 사람으로 분류하겠습니다.
빨간점이 바로 데이터이며, 액션의 0과 1이 바로 레이블입니다.
레이블이 있다는 것은, 수퍼바이저드 러닝이라는 뜻입니다.


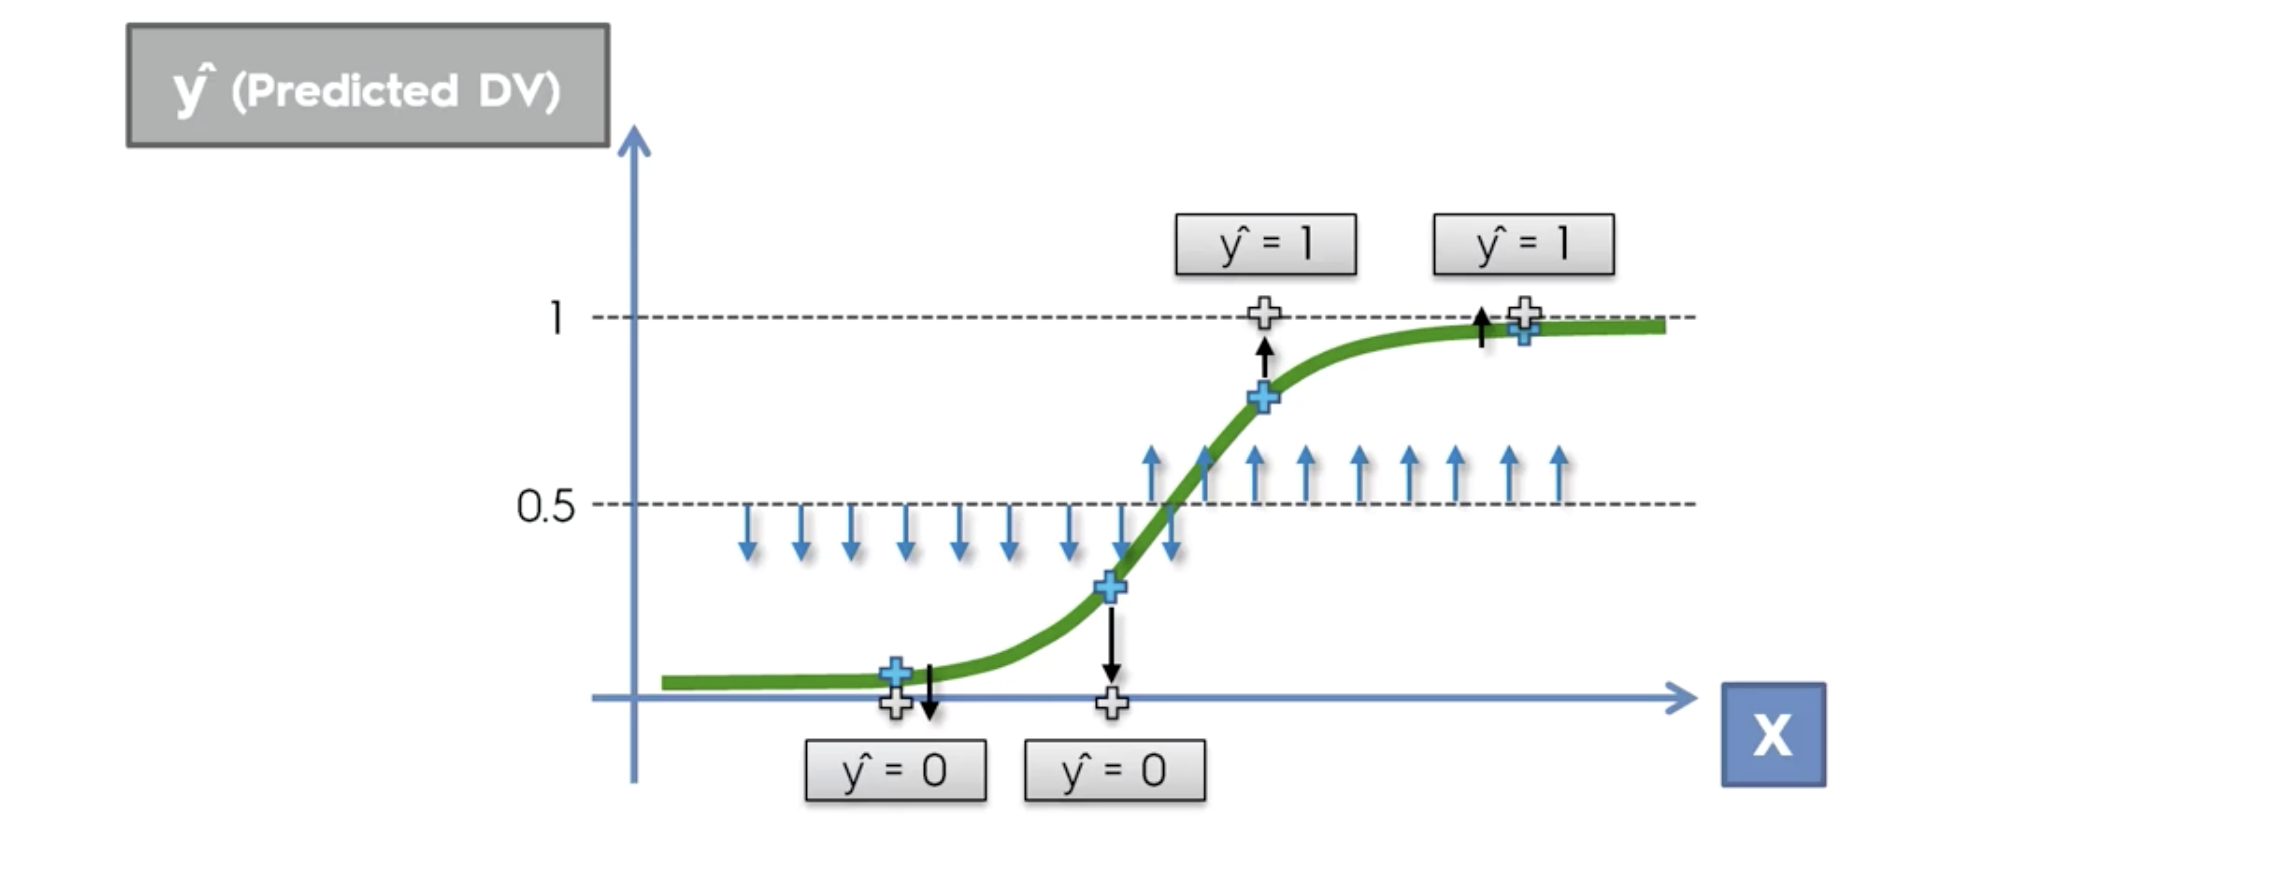
중요! 이렇게 비슷하게 생긴 함수가 이미 존재합니다.
이름은 sigmoid function

따라서 리니어 리그레션 식을, y 값을 시그모이드에 대입해서 , 일차방정식으로 만들면 다음과 같아집니다.

위와 같은 식을 가진 regression을, Logistic Regression이라 합니다.
이제 클릭을 한다, 안 한다로 두개의 클래스로 분류할 수 있습니다.
확률로 나타낼 수 있습니다.
p는 확률값을 나타냅니다.

20대는 클릭할 확률이 0.7%, 40대는 85%, 50대는 99.4%
이 확률값은, 위에서의 시그모이드 함수를 적용한 식을 통해 나온 값임을 기억합니다.

최종 예측값은, 0.5를 기준으로 두개의 부류로 나눈다. 그 값은 0 과 1 이다.

구글드라이브 import
from google.colab import drive
drive.mount('/content/drive')
필요한 라이브러리 import
import numpy as np
import matplotlib.pyplot as plt
import pandas as pd
나이와 연봉으로 분석해서, 물건을 구매할지 안할지 분류해봅니다.
df=pd.read_csv('/content/drive/MyDrive/위치/Social_Network_Ads.csv')Nan 확인(없지만 확인하는 습관!)
X,y 컬럼 분류
X=df.loc[:,['Age','EstimatedSalary']]
y=df['Purchased']
숫자인지 확인 int64 (이것도 숫자지만 확인하는 습관)
로지스틱 리그레션은 피처스케일링 합니다.
from sklearn.preprocessing import StandardScaler
scaler = StandardScaler()
X=scaler.fit_transform(X)

#train,Test 용 데이터 만들기

from sklearn.model_selection import train_test_split
X_train,X_test,y_train,y_test=train_test_split(X,y,test_size=0.25,random_state=3)

#모델링,분류의 문젱이므로 분류의 문제 해결할수 있는 인공지능으로 모델링한다

from sklearn.linear_model import LogisticRegression
classifier = LogisticRegression(random_state=3)
classifier.fit(X_train,y_train)

#성능 평가 테스트한다
y_pred = classifier.predict(X_test)
y_test는 인공지능이 볼 시험
y_testy_pred는 테스트 후
y_predConfusion Matrix

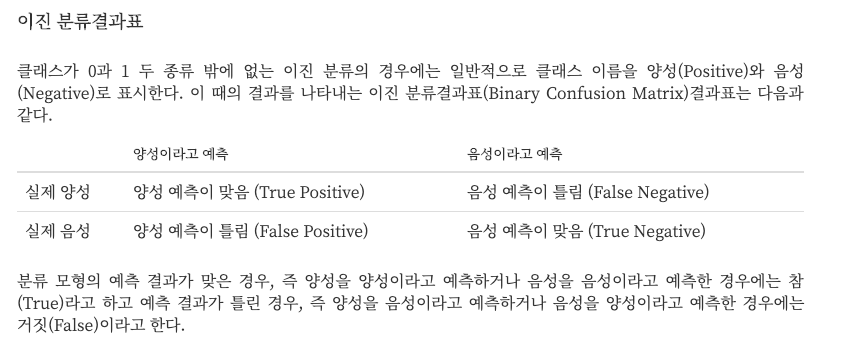
두개의 클래스로 분류하는 경우는 아래와 같습니다.


from sklearn.metrics import confusion_matrix
cm=confusion_matrix(y_test,y_pred)
cm
정확도 accuracy 계산
#맞춘것의 개수 / 전체 개수
(61+23) / cm.sum()
from sklearn.metrics import accuracy_score
accuracy_score(y_test,y_pred)저는 84프로 나왔습니다.
from sklearn.metrics import classification_report
classification_report(y_test,y_pred)

print(classification_report(y_test,y_pred))


아래는 테스트 데이터로 나온 예측 결과를 나타낸 것입니다.
Confusion Matrix 와 같습니다.
아래 코드들은 그대로 활용하기
from matplotlib.colors import ListedColormap
X_set, y_set = X_test, y_test
X1, X2 = np.meshgrid(np.arange(start = X_set[:, 0].min() - 1, stop = X_set[:, 0].max() + 1, step = 0.01),
                     np.arange(start = X_set[:, 1].min() - 1, stop = X_set[:, 1].max() + 1, step = 0.01))
plt.figure(figsize=[10,7])
plt.contourf(X1, X2, classifier.predict(np.array([X1.ravel(), X2.ravel()]).T).reshape(X1.shape),
             alpha = 0.75, cmap = ListedColormap(('red', 'green')))
plt.xlim(X1.min(), X1.max())
plt.ylim(X2.min(), X2.max())
for i, j in enumerate(np.unique(y_set)):
    plt.scatter(X_set[y_set == j, 0], X_set[y_set == j, 1],
                c = ListedColormap(('red', 'green'))(i), label = j)
plt.title('Classifier (Test set)')
plt.xlabel('Age')
plt.ylabel('Estimated Salary')
plt.legend()
plt.show()
아래는 학습에 사용된 데이터를 그래프로 나타낸 것입니다.
from matplotlib.colors import ListedColormap
X_set, y_set = X_train, y_train
X1, X2 = np.meshgrid(np.arange(start = X_set[:, 0].min() - 1, stop = X_set[:, 0].max() + 1, step = 0.01),
                     np.arange(start = X_set[:, 1].min() - 1, stop = X_set[:, 1].max() + 1, step = 0.01))
plt.figure(figsize=[10,7])
plt.contourf(X1, X2, classifier.predict(np.array([X1.ravel(), X2.ravel()]).T).reshape(X1.shape),
             alpha = 0.75, cmap = ListedColormap(('red', 'green')))
plt.xlim(X1.min(), X1.max())
plt.ylim(X2.min(), X2.max())
for i, j in enumerate(np.unique(y_set)):
    plt.scatter(X_set[y_set == j, 0], X_set[y_set == j, 1],
                c = ListedColormap(('red', 'green'))(i), label = j)
plt.title('Logistic Regression (Training set)')
plt.xlabel('Age')
plt.ylabel('Estimated Salary')
plt.legend()
plt.show()
'머신러닝' 카테고리의 다른 글
| Support Vector Machine (0) | 2022.03.28 |
|---|---|
| K-Nearest Neighbor (K-NN) (0) | 2022.03.28 |
| Multiple Linear Regression (0) | 2022.03.28 |
| Linear Regression (0) | 2022.03.28 |
| Data Preprocessing,Feature Scaling and OneHotEncoding 머신러닝에 필요한 데이터 처리 (0) | 2022.03.28 |